Analytics: Know what worked,then make more of it.
Every post on Instagram, TikTok and YouTube is marked a hit or a flop against your own normal, with why it landed and what to make next.
 Northfold Coffee Instagram · last 30 days
This week's suggestions
A sample brand and sample posts. It runs by itself.
Sound familiar?
Tap the ones that sound like your team.
Friday, looking back
“Was that a good post, or just a good month?”
One post took off
“Our best post of the month, and nobody can say why it worked.”
Planning next month
“Great, it worked. Now what do we post?”
Ten minutes before a client call
“Our numbers live in three different apps.”
Here's how it fixes them.
Each fix, as it works in BrndStreet.
Hits and flops · Instagram
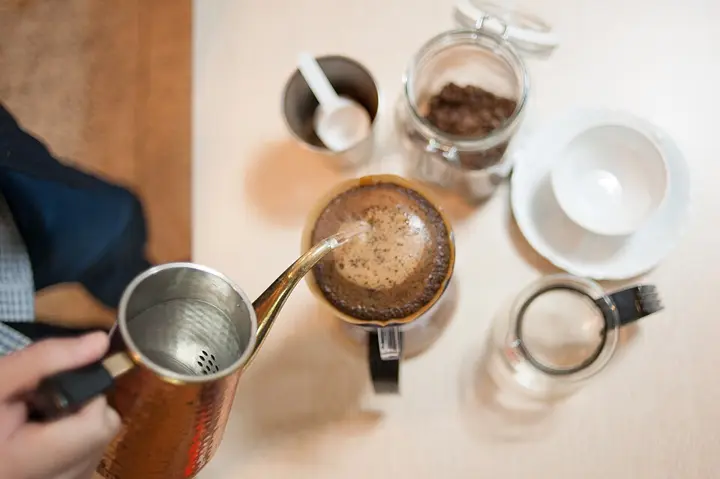
The kettle, start to cupReel · 27K views2.7×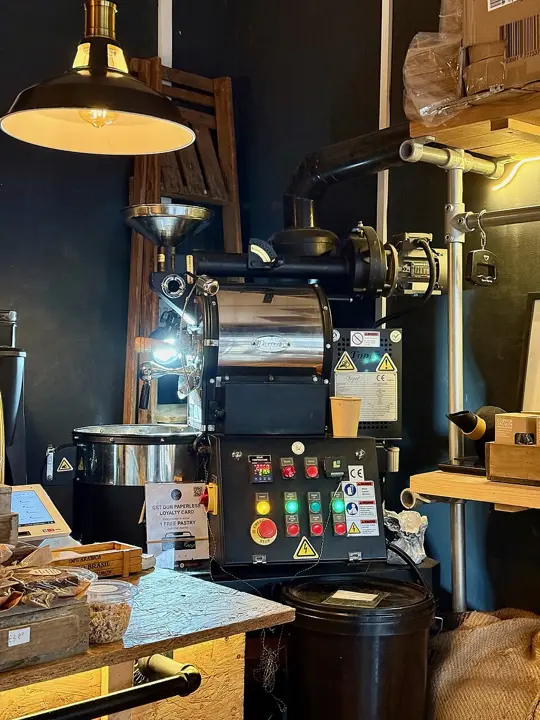 Monday roast is inReel · 24K views2.4×
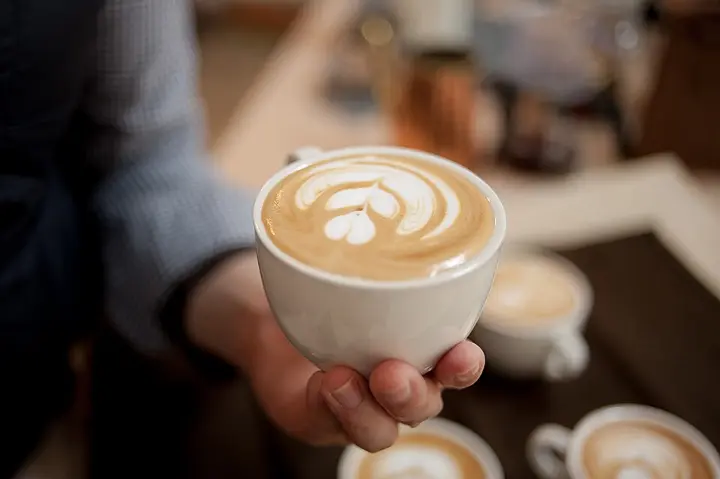 Latte art, slowed downReel · 11K views1.1×
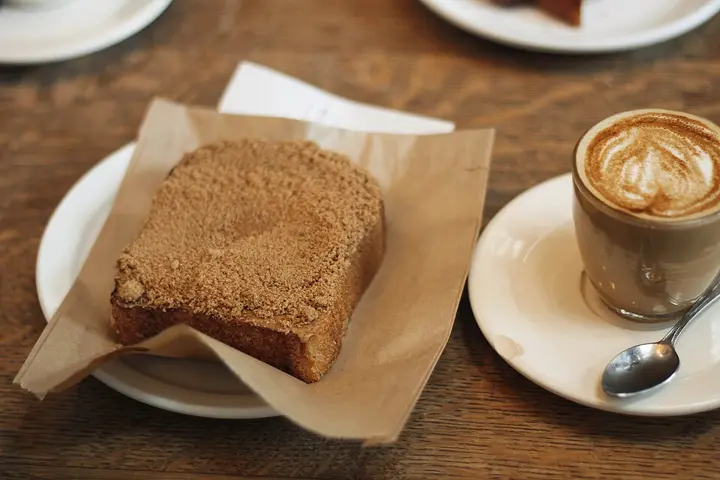 Our new price listCarousel · 190 likes0.2×
Every post is marked a hit, a flop or normal against your own account, so a good post stands out.
- Every post, sortedFilter down to just the hits or just the flops.
- Fair at any sizeA small account's breakout counts as much as a big one's.
- Your weakest postsThe three that pulled you down, so you stop making them.
Inside Analytics.
The answers you'd otherwise dig out of three different dashboards.
Turn your sound on. The kettle's about to click.
“I could hear it.”
Our new price listNothing to stop the scroll in slide one0.2×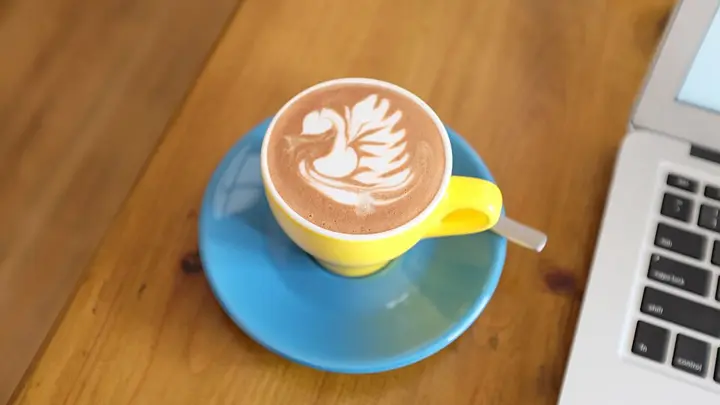 Opening hours updateRead as a notice, not a post0.1×The kettle, start to cup2.7×
Tap a post to see why.
A sample month of twelve posts against the account's usual. Tap one for what happened and what to try next.
Your last twelve posts · usual 10K views
Green is twice the usual or more. Red is under a quarter.
The kettle, start to cupReel · 7 Oct · 27,200 viewsWhy it worked
It opened on sound with no music, so people turned it up. “I could hear it” came up again and again in the comments.
Try next
Make one like this with the grinder, keeping the sound-first opening.
A sample month for a sample brand. Your own posts replace it.
Who it's for.
Pick the one that sounds like you.
Every client's month, explained.
Each brand is measured against its own normal, so a small client's breakout counts, and you know why before the call starts.
- Hits and flops for every client brand
- The reason behind each one, written out
- Straight into a client report
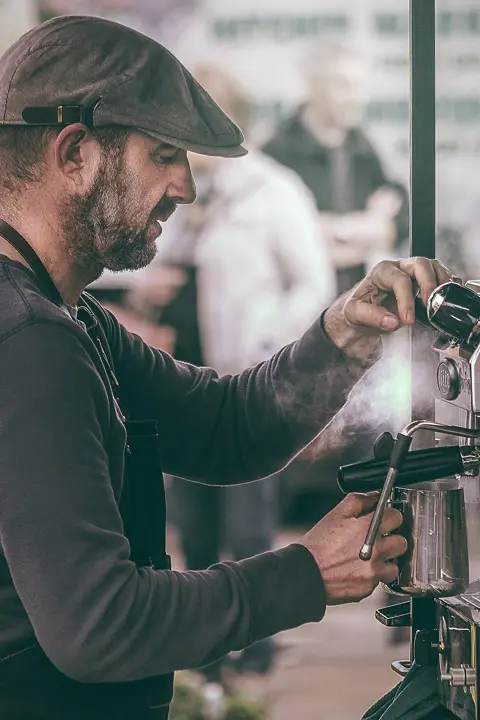 4.0×
Questions about Analytics.
Which social media platforms does BrndStreet analytics cover?
Instagram, TikTok and YouTube, read from the accounts you connect. Each platform gets its own view, and every post is judged against its own account.
How do I know if a post actually did well?
Each post is compared with your own normal for the same account and the same kind of post. About twice that normal makes it a hit and under a quarter makes it a flop, so a good month can't pass for a good post.
Can I see why a post worked?
Yes. Open the post and it reads the hook, the beats and the call to action, then explains why it landed or fell flat. Once a post is read, everyone on the brand can open it.
Does it count posts I didn't publish through BrndStreet?
Yes. Posts you put up straight from Instagram, TikTok or YouTube are read from the connected account like any other.
Can I turn my analytics into a client report?
Yes. The same numbers build a white-label report straight from the Analytics page, and you can email it, share it as a link or download it as a PDF.
Why does a number show a dash instead of a zero?
The platform didn't report it. We never fill a missing number with a zero, because a made-up zero would drag your normal down and make the next post look better than it was.
Find out what worked last month.
Connect your accounts and see which posts landed, why they did and what to make next.